Flow Chart
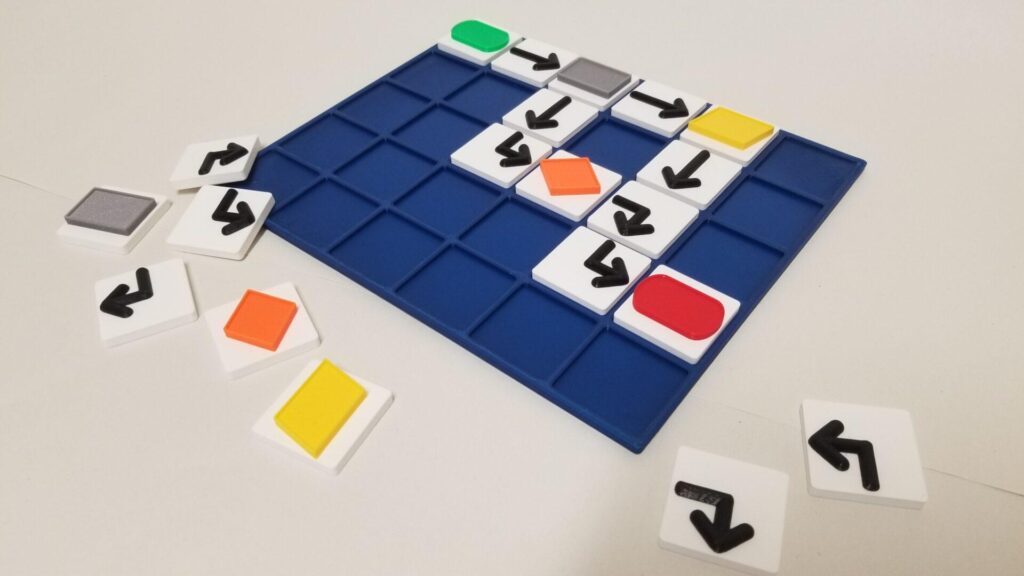
A tactile model of a flow chart. Flow charts are used to graphically represent a process and the choices, decisions […]
A tactile model of a flow chart. Flow charts are used to graphically represent a process and the choices, decisions […]
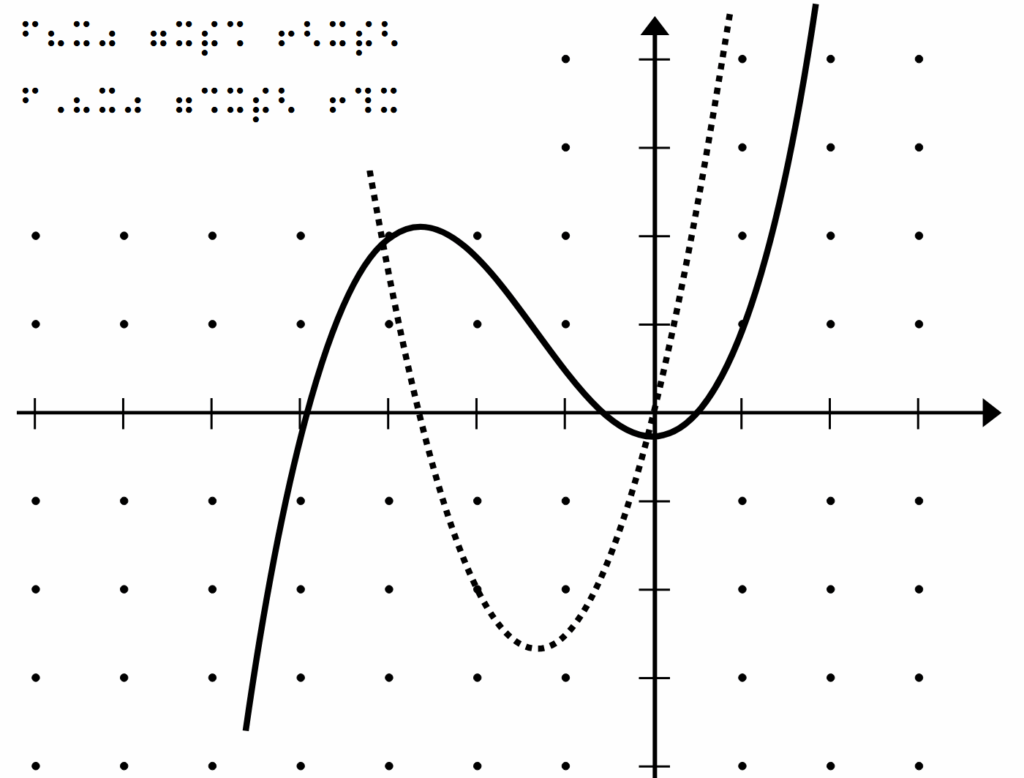
The illustration shows the function f(x)= x^3+ 2x^2 and its derivative f'(x)= 3x^2 +4x. The graph is available as a