The Finnish developer Samuli Kärkkäinen has developed and published the online tool https://touch-mapper.org, which enables tactile maps to be generated for printing on a 3D printer. The map data is based on OpenStreetMap and is generated automatically.
Touch Mapper generates street maps that non-sighted people can use to orientate themselves within cities. In a school context, these could also be used in orientation and mobility education. The maps contain a range of information such as roads for cars, paths for cyclists, buildings (optional), railway tracks or bodies of water. However, it is not possible to generate topographic or political maps with this tool.
The generated map can be downloaded for free as an STL file for printing on one’s own 3D printer or the map can be ordered directly from a service provider (only available in a few countries).
Map creation process
- Go to the website and enter an address. This will appear at the centre of the map generated.
- A number of settings can now be selected. Advanced options are also available to choose from.
- Click on “create tactile map” to generate the map. This process takes a few seconds.
- If the “Print the map yourself” option is selected, the STL file of the map can be downloaded via the button “Download printable STL file”.
Settings
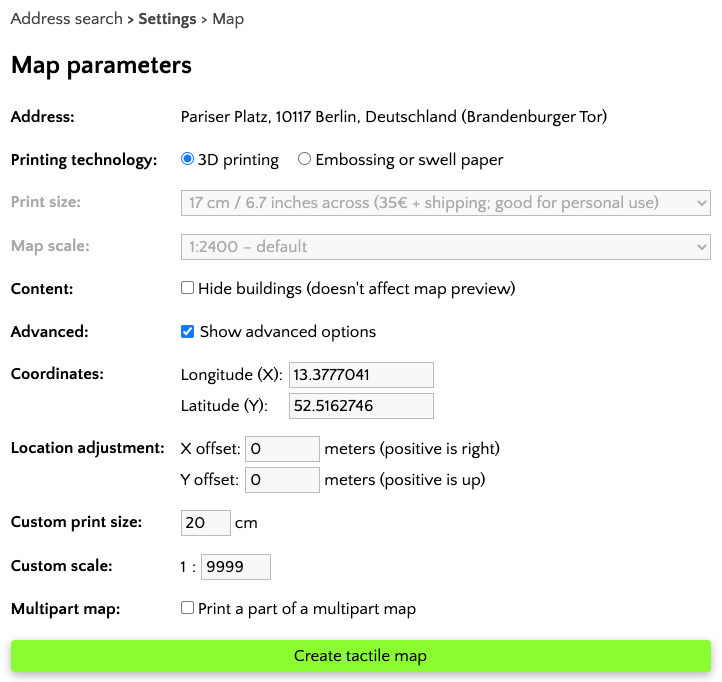
The most relevant settings are the scale and the print size. The scale setting determines how large the section of the map selected will be. The smallest possible scale is 1:500, which, to put it simply, means that the map is magnified in size. However, if the map is to give an overview of a larger area, a larger scale should be selected. At the largest possible scale of 1:9999, however, the streets, buildings, bodies of water etc. to be represented on the map to be printed become very . If buildings are hidden for reasons of clarity, then a scale of 1:3000 should be selected for a map size of 20x20cm. If you zoom out further, the distances between the streets probably become too small and the clarity suffers (depending on the local conditions; city vs. countryside).
This is where the map size comes into play, which is given in centimetres. Since 3D printers generally do not have a very large print bed, it will most likely be used in its entirety. By default, the map will therefore have a size of just under 20x20cm.
If the finished map is to be larger than this size, you either need a printer with a larger print bed or the maps must be printed in several parts and then glued to a wooden base or something similar. To do this, select the “Print a part of a multipart map” box. However, this option often does not work reliably. Therefore, there is also the option of enlarging the STL file after downloading and cutting it into several parts using software such as Netfabb or similar.
Structure of the maps and assessment of quality
and mobility in cities. Therefore, both streets and footpaths are shown. These are tactilely distinguishable from each other, as streets are shown wider and flatter than dedicated footpaths. Remarkably, even small footpaths in a city park or similar are included. Buildings can be hidden or shown via a tick box on the website. Although the OpenStreetMap map material contains information such as bus and train stops, these are not shown tactilely. Only the address entered on the website is provided with a point symbol. The orientation of the map is indicated by a tactile marker in the northeast corner. If the map is turned so that the raised square is in the bottom left corner, then south points straight ahead. There is no braille on the maps.
Due to the excellent quality of OpenStreetMap, the maps are produced in STL format true to scale and detailed. This technology represents a quantum leap forward in comparison to classic map construction by hand. However, the automated process does not produce didactically ideal maps. Buildings and especially their ground layout are generally of little relevance to non-sighted people when navigating in cities, as streets and paths form the network of orientation. Despite the option of hiding buildings, the maps are often overloaded. Since all streets and roads are shown, there is no reduction in complexity. Even some seemingly complex details are not pared down for the map display. On the other hand, other important features of a map such as the marking of bus stops, traffic lights, pedestrian crossings, etc. are missing.
Theoretically, the maps can be post-processed with the user’s individual 3D software. In practice, however, this is not practical in many cases, as STL files are usually not well suited to post-processing, making the process very time-consuming. Ultimately, each designer must judge for themselves how much time and effort they can invest in a better, more individual map.
The printing time of the maps should not be underestimated, as the base plate is only 0.6mm high but takes an enormous amount of time to print due to the horizontal geometry.
Dividing a map into several parts
If you want to divide a map yourself or cut off edges, you usually have to use a piece of software. Unfortunately, editing STL files with one’s usual 3D software is not really effective in most cases. As can be seen in the following picture, an STL file can be edited with Sketchup and in this case also divided, but this is very time-consuming and error-prone.

A better option is to use software that has been specially developed for this purpose. Netfabb is very easy to use. Unfortunately, Netfabb has not been free for a long time, but the last freeware version can still be downloaded and installed.
Users of Windows 10 or 11 are recommended to use 3D Builder, which can be downloaded for free from the Windows App Store. This program is particularly impressive in that it has a very simple structure due to the reduced options available. Cutting STL files is demonstrated in this video.
Meshmixer from Autodesk, on the other hand, is more universal and can be downloaded from https://meshmixer.com/ An introduction to editing with Meshmixer is given in this video.
Example
The image below shows the school grounds of the Schloss-Schule Ilvesheim. The map was cut and post-processed so that only the school grounds themselves and the access road are shown. It is remarkable that even the footpaths on the enclosed school grounds are part of the map.