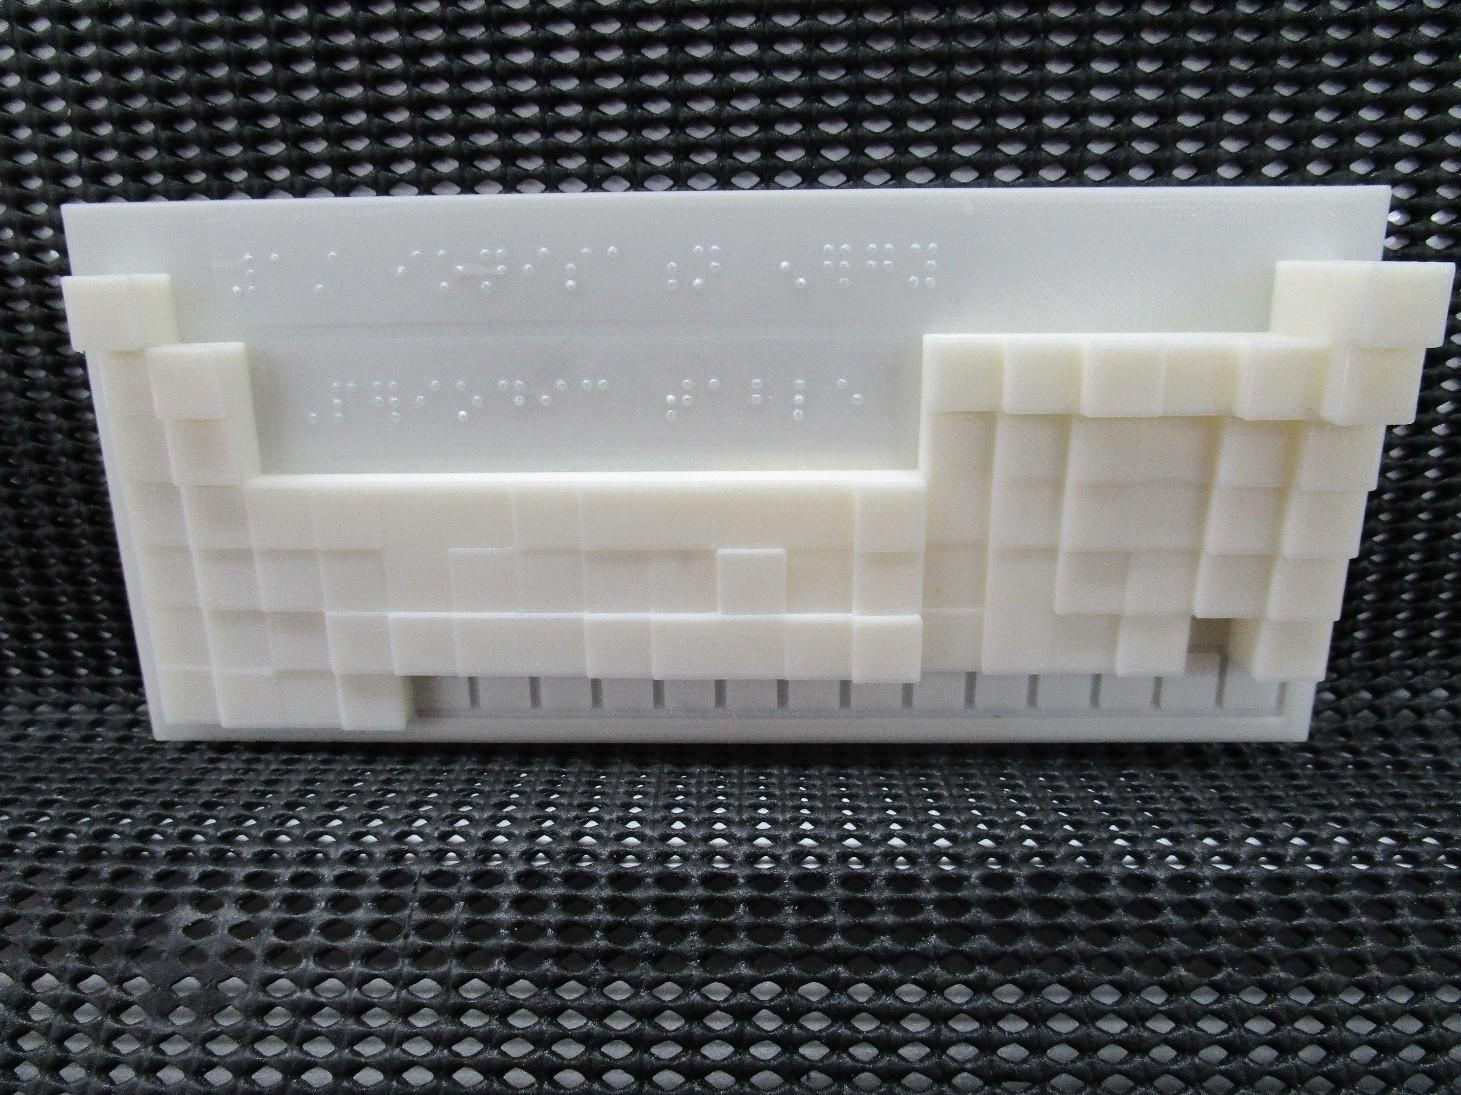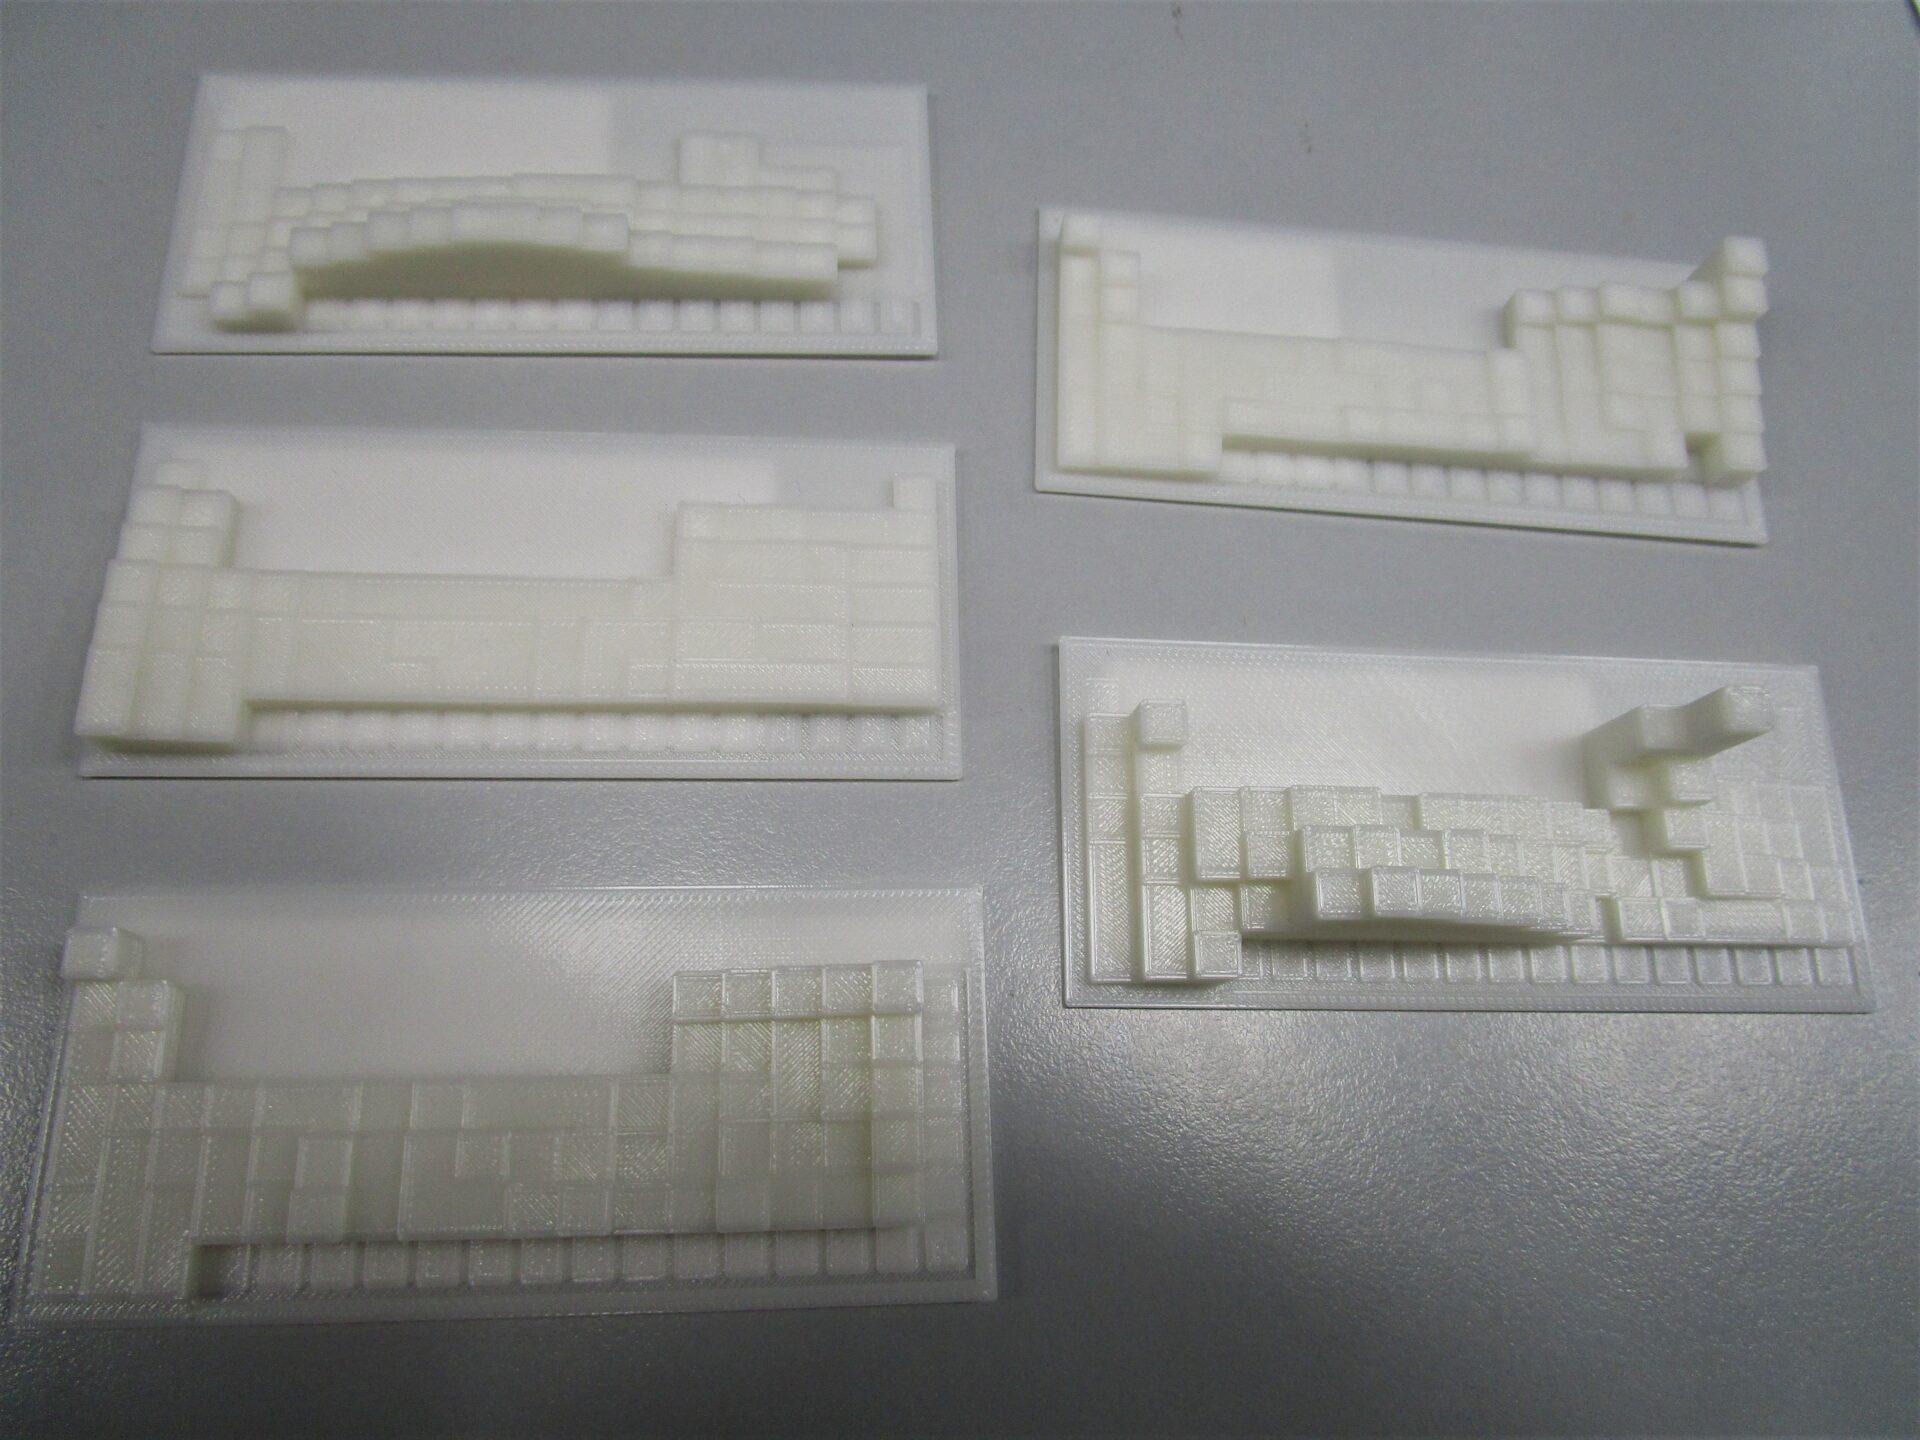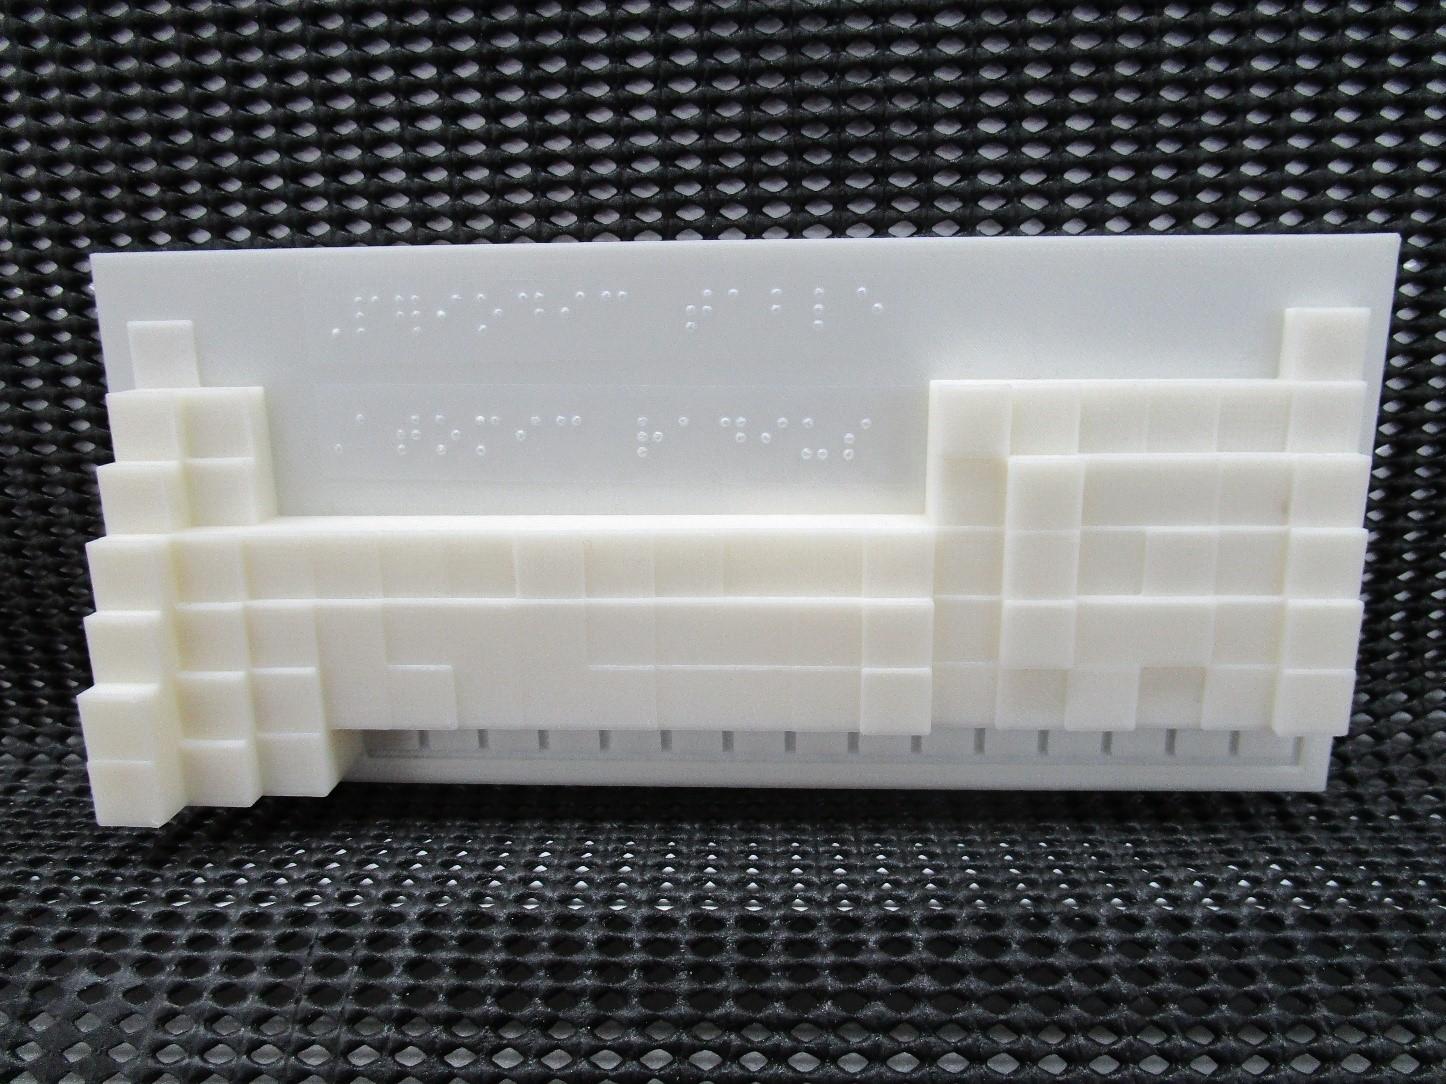
These prints show several different properties of the elements. The height is used to give a sense of the trend over the whole periodic table, as such individual elements aren’t labelled.
Periodic Table – density
The height of the model represents the relative density of each element on the periodic table. All but two elements (Radium and Actinium) in the bottom period have unknown densities. The Noble Gases (rightmost group) are all gases and so have very low density. These also have minimal height otherwise they would not have shown on the model.
The trends are:
- Density generally increases going down a group.
- Density generally increases towards the middle of a period and then decreases on the edges of a period.
Data is from The Royal Society of Chemistry (UK)
The Lanthanides and Actinides were not included in this model.
Periodic Table – atomic radius
The height of the model represents the relative atomic radius (non-bonded) of each element in the periodic table. In Period 7 (bottom period), all but the first three elements (Francium, Radium and Actinium) have unknown atomic radii. These elements are shown with a grooved outline and no height.
The trends are:
- Atomic radius generally increases going down a group. This is particularly seen in the first three groups and the last group (Nobel Gases).
- Atomic radius generally decreases going from the left to the right across a period.
- The transition metals (centre block of 10 groups and 3 periods) all have very similar atomic radii.
Data is from The Royal Society of Chemistry (UK)
The Lanthanides and Actinides were not included in this model.
Periodic Table – electronegativity (en)
The height of the model represents the electronegativity of each element in the periodic table. In Period 7 (bottom period), all but the first three elements (Francium, Radium and Actinium) have unknown electronegativities. The Nobel gases have a stable outer shell and do not readily form bonds. These elements are shown with a grooved outline and no height.
The trends are:
- Electronegativity increases across a period
- Electronegativity decreases down a group
Data is from The Royal Society of Chemistry (UK)
The Lanthanides and Actinides were not included in this model.
Periodic Table – first Ionisation Energy (1st ie)
The height of the model represents the first ionisation energy of each element in the periodic table. In Period 7 (bottom period), all but the first four elements (Francium, Radium, Actinium and Rutherfordium) have unknown first ionisation energy. Astinine (Period 6, Group 17) also has unknown ionisation energy. These elements are shown with a grooved outline and no height.
The trends are:
- First ionisation energy generally decreases going down a group.
- First ionisation energy generally increases going from the left to the right across a period.
Data is from The Royal Society of Chemistry (UK)
The Lanthanides and Actinides were not included in this model.
Periodic Table – melting point
The height of the model represents the melting point of each element in the periodic table. In Period 7 (bottom period), all but the first three elements (Francium, Radium and Actinium) have unknown melting points. These elements are shown with a grooved outline and no height.
The trends are:
- First ionisation energy generally decreases going down a group.
- First ionisation energy generally increases going from the left to the right across a period.
Data is from The Royal Society of Chemistry (UK)
The Lanthanides and Actinides were not included in this model.
Periodic Table – year of discovery
The height of the model represents the year of discovery of each element in the periodic table. There are several elements with a year of “0” as they have been known of since antiquity. These are C, S, Fe, Cu, Zn, Ag, Sn, Sb, Au, Hg and Pb. All other elements were discovered after 1200, so this has been removed from their height for ease of understanding. 1mm = 100 years